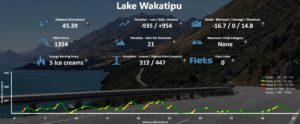
Finding a ride according to your fitness level is easy on Open Road. The effort needed to complete the ride is probably the most important parameter. But there are other parameters you can use such as distance, elevation gain, average gradient, Fiets, climb category, the profile of the ride, and more. You can read about all the parameters below.
If you have just started riding, you can also read our article Starting as a beginner.
Using effort to find a ride #
All rides have an effort score. A high effort score means the ride requires a lot of effort to complete. Easy rides require a low effort because there is little elevation gain, and the distance is short. Rides with low effort and high distance mean there is not a lot of climbing involved, while rides with high effort and a short distance mean the rides are very steep and difficult.
The effort score makes it possible to finish one ride and compare the effort score to other rides. If you found a ride to be too difficult, then next time you can pick a ride that has a lower effort score. If you found it to be too easy, then next time pick a ride with a higher effort score.
To find a ride with an effort score according to your fitness level is simple. All you have to do is to go to the cloud library and sort the rides according to ‘effort’:
Using steepness find a ride #
Besides effort, the steepness (gradient) of the road also plays an important role in assessing how difficult a ride is. You have the option of clicking on each ride to learn about the ride in detail.
Each ride has a profile colored according to the grade of the road:
In the upper right corner of the profile, you can see the distance within each group of gradients:
If you are not accustomed to riding routes with steep segments, then you can pick rides that are less steep. And if you want to push your limits, then you can find rides that are stepper, than previous rides you have done.
Other parameters to find a ride #
Besides the effort score, there are other parameters that will help you understand whether the ride is right for you. By clicking on a ride in the cloud library, you get more detailed information:

Each parameter tells you a bit about the ride. But no parameter tells you the complete story. ‘The best thing is to look at several parameters to get a good understanding of the ride.
Distance #
Distance is a very common parameter used to find a ride. But the length of a ride should not stop you from doing it. You always have the option of breaking a ride into several segments and complete it over several days.
Elevation gain and loss #
Elevation gain tells you how much you will climb in total. The more you climb on a ride, the more difficult you can expect the ride to be. Elevation loss tells you how much you will descend in total. Often it is nice to find a ride with a bit of both, so your legs can rest a bit.
Elevation gain per unit of distance #
Elevation gain per unit of distance is a great tool to understand how difficult the ride is. The higher the number, the more intensive you can expect the ride to be.
Fiets #
The Fiets Index is a method to calculate how difficult a climb is. The strength of the calculation is that you can compare one climb to another. A high number means you climb a lot within a short distance. The weakness of the index is that it is only precise for climbs. For rides where you also descend, it loses its accuracy.
Climb categories #
The categorization of mountain climbs originates from the Tour de France. It is used to categorizing the difficulty of the climb. The HC climb is the most difficult type of climb. It is more demanding than a Category 1 climb, which again is more demanding than a Category 2 climb, and so on. The easiest category is Category 4. The categorization reflects the most strenuous climb of the entire ride.
Average and maximum grade #
The maximum grade gives you a good sign of how difficult a ride is. The higher the number, the steeper climbs you can expect. The average grade gives you a good indication of the difficulty.
Energy burning score #
Our ‘Energy Burning Score’ (or ice cream score….) gives you an indication of how much energy is burned on each ride. Because the score is calculated with the same parameters for each ride, you can use the score to compare one ride to another. Please note that the exact energy burned during the ride will vary depending on weight, gender, age, fitness level of the individual rider, and the effort put into completing the ride.
The profile #
The profile can be useful to getter a more fine-grained understanding of the anatomy of the ride. Many of our members like rides with short climbs and descents. These rides will give you a pleasant break to catch your breath after each small climb. The profile helps you to find this kind of ride.
Description #
There is more to each ride than the cold facts above can convey. The description of the ride often helps you to get an understanding from another perspective. Factors such as scenery and history are also important to get a good and motivating ride.


